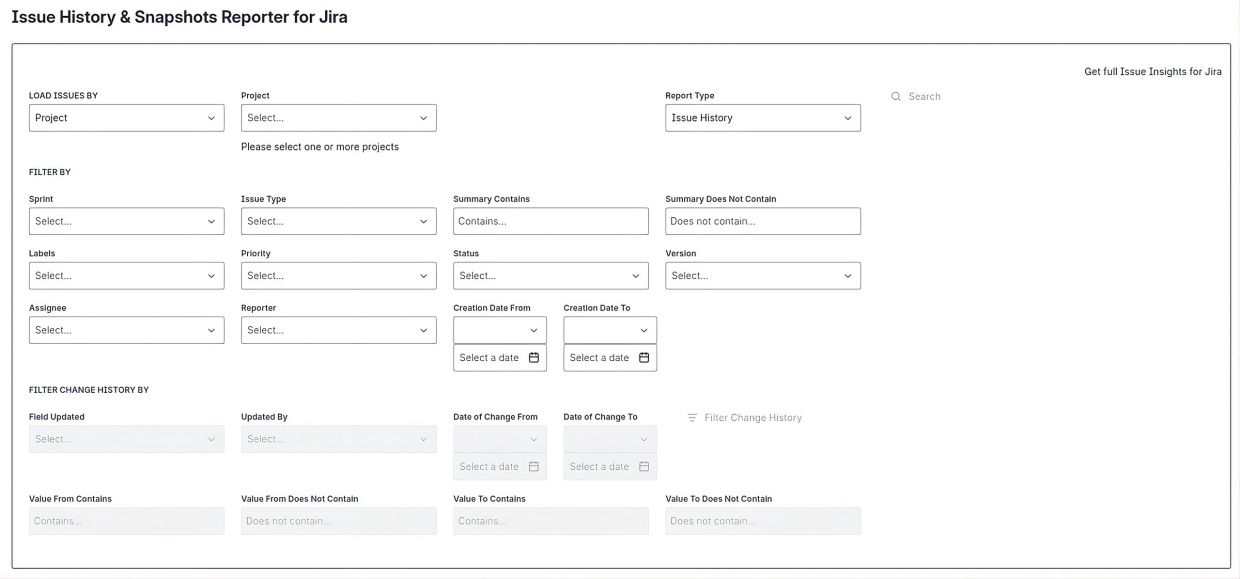
The application guides users through a flexible workflow for retrieving, analyzing, and exporting Jira issue history and snapshots.
Users begin by selecting a Load Issues By method and a Report Type.
Issues can be retrieved using thirteen different selection methods: Assignee, Creation Date, Filter, Issue, Issue Type, Label, Project, Priority, Reporter, Status, Sprint, Summary, and Version. Each method supports single or multiple values, allowing issue sets to range from a single issue to large, dynamically defined collections spanning multiple projects, users, issue types, sprints, versions, or other criteria.
The application supports three report types: Issue History, Issue Snapshot, and Snapshot Comparison. Issue Snapshot is the default report type.
The Filter By section is optional. If no filters are specified, all issues matching the selected retrieval method are loaded and displayed. When one or more filters are provided, the initially retrieved issue set is refined before the report is generated, allowing users to focus on the information most relevant to their analysis.
Once the report is generated, the resulting data is displayed in a table. When working with the Issue History report, users can further refine the returned history records using the Filter Change History By section. Unlike the initial search filters, these filters operate on the generated history data itself, making them ideal for isolating specific field changes, users, or time periods during audits and investigations.
Because history filtering requires additional processing of the generated history records, it is generally recommended for result sets up to approximately 100,000 issues, although larger datasets can also be analyzed depending on the amount of history involved. Initial issue retrieval is designed to support very large Jira environments and can efficiently process datasets containing millions of issues through paginated data retrieval.

This example retrieves issues from the Apples project, limited to Story and Task issue types, and generates an Issue History report. The history results are further restricted to changes affecting the Status and Resolution fields, allowing the report to focus on specific workflow and resolution updates.
The Refresh Data button reloads data from Jira using the currently selected search criteria, ensuring that subsequent searches are performed against the most up-to-date issue information.
Set Visible Columns allows users to choose which columns are displayed in the results table, making it easier to focus on the information most relevant to their analysis.
Set Truncation allows users to specify which columns containing potentially large text values should be truncated to 22 characters when displayed in the table. This improves readability and helps keep wide reports manageable without affecting the exported data.
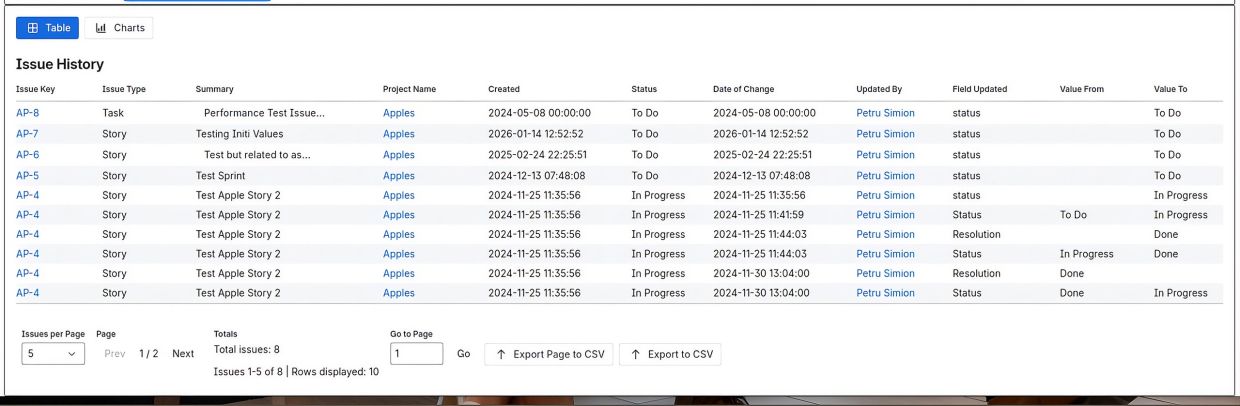
Issue History – Search Result
The result is presented in a table with sortable columns and pagination. Each row represents a single history change recorded for an issue.
In addition to standard issue information such as issue key, issue type, project, status, assignee, reporter, and sprint, the report includes the details of each change, including:
- The date and time when the change occurred.
- The user who performed the change.
- The field that was modified.
- The previous field value.
- The new field value.
This allows users to identify what changed, when the change occurred, and who performed the update, providing a complete audit trail of issue activity.
The results are displayed in a paginated table. Users can navigate sequentially using the Previous and Next controls or jump directly to a specific page using the Go To Page functionality.
When working with very large result sets containing millions of issues and tens of thousands of pages, jumping directly to a distant page may require additional indexing and positioning operations and may therefore take longer than sequential navigation.
The number of rows displayed per page is configurable.
The application provides two export options:
- Export Page to CSV exports only the records displayed on the current page. All available columns are included and values are exported in their complete form, regardless of any truncation settings applied to the table view.
- Export to CSV exports the entire result set across all pages. All available columns are included and values are exported in their complete form.
The Set Visible Columns and Set Truncation options affect only the visual presentation of data within the application and are intended to improve readability when working with large datasets. These settings do not affect exported data, which always contains complete, untruncated values for all available columns.
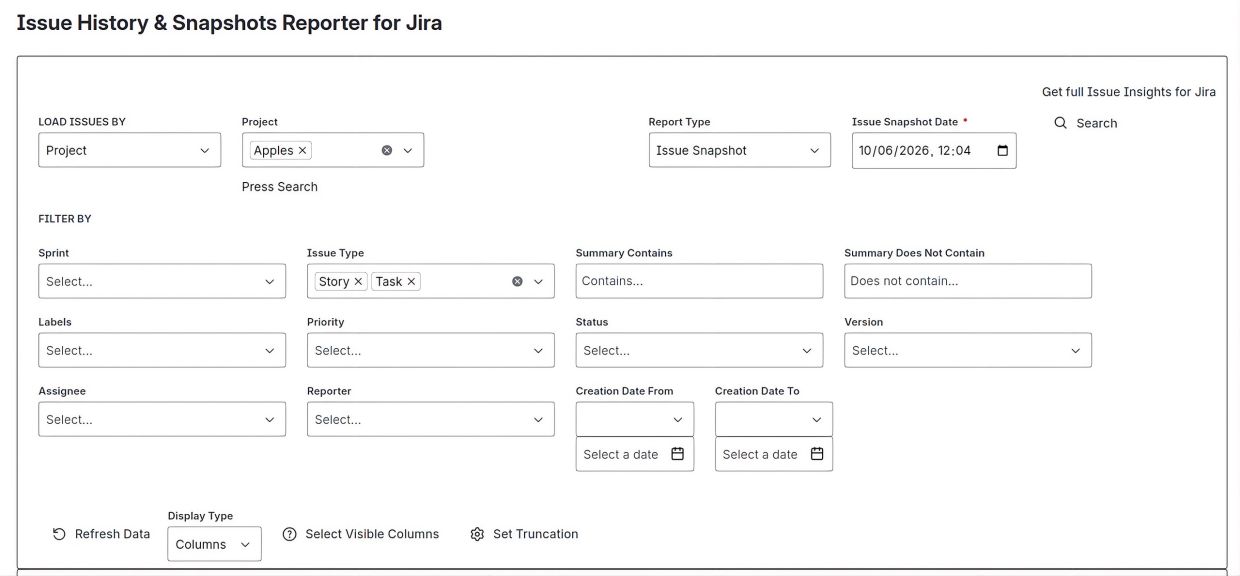
When Issue Snapshot is selected as the report type, choose the date and time for which the issue state should be reconstructed. The report will display each issue exactly as it existed at the selected moment, using the issue history available in Jira.
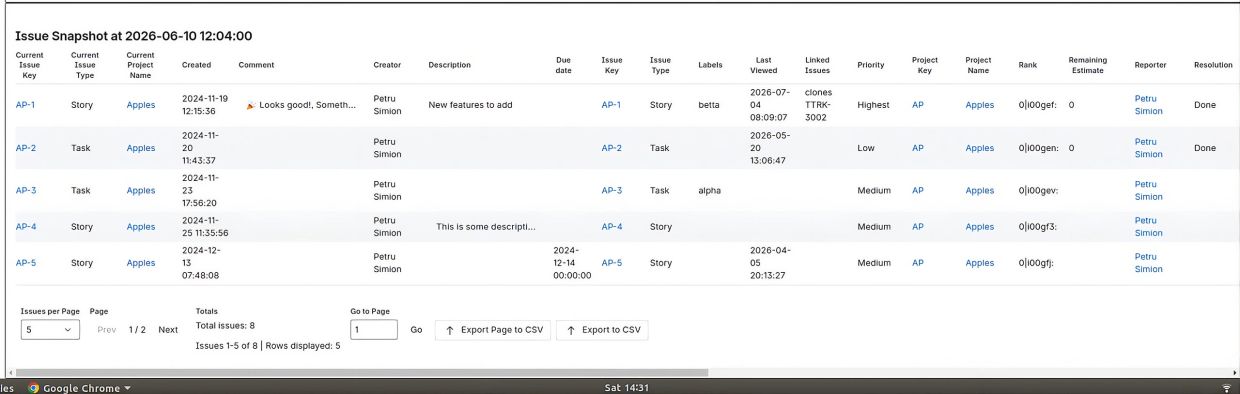
Issue Snapshot – Column-Based Search Result
The result is presented in a table with sortable columns. Each row represents a single issue reconstructed as it existed at the selected snapshot date and time.
The table contains one column for every issue field that contains a value for at least one of the returned issues at the selected snapshot date. Each cell displays the value of that field as it existed at the selected moment in time.
In addition to standard Jira fields, the report may include custom fields, Agile fields, Assets fields, and other application-specific fields available in the Jira instance.
Because the number of returned fields can be large, the table provides a horizontal scrollbar, allowing users to navigate through all available columns without limiting the information displayed.
The Issue Snapshot report provides a complete point-in-time reconstruction of issue data, making it possible to review historical issue states for auditing, compliance, reporting, and investigative purposes.

Issue Snapshot – Row-Based Search Result
The result is presented in a table with sortable columns and pagination. Each row represents a single field value belonging to an issue at the selected snapshot date and time.
For every returned issue, the report displays one row for each field that contains a value at the selected snapshot moment. Alongside the issue information, the report identifies the field name and the corresponding historical value that existed at that time.
This format is particularly useful when users need to review, filter, export, or analyze individual field values rather than viewing the complete issue state in a wide column-based layout.
The report includes standard Jira fields, custom fields, Agile fields, Assets fields, and other application-specific fields available in the Jira instance. Each displayed value represents the exact value recorded for that field at the selected snapshot date and time.
Because each field value is displayed as a separate row, a single issue may generate multiple rows in the result set, one for each field containing a value at the selected snapshot moment.
This report provides a normalized, export-friendly representation of historical issue data and is particularly useful for auditing, reporting, integrations, and downstream data processing.
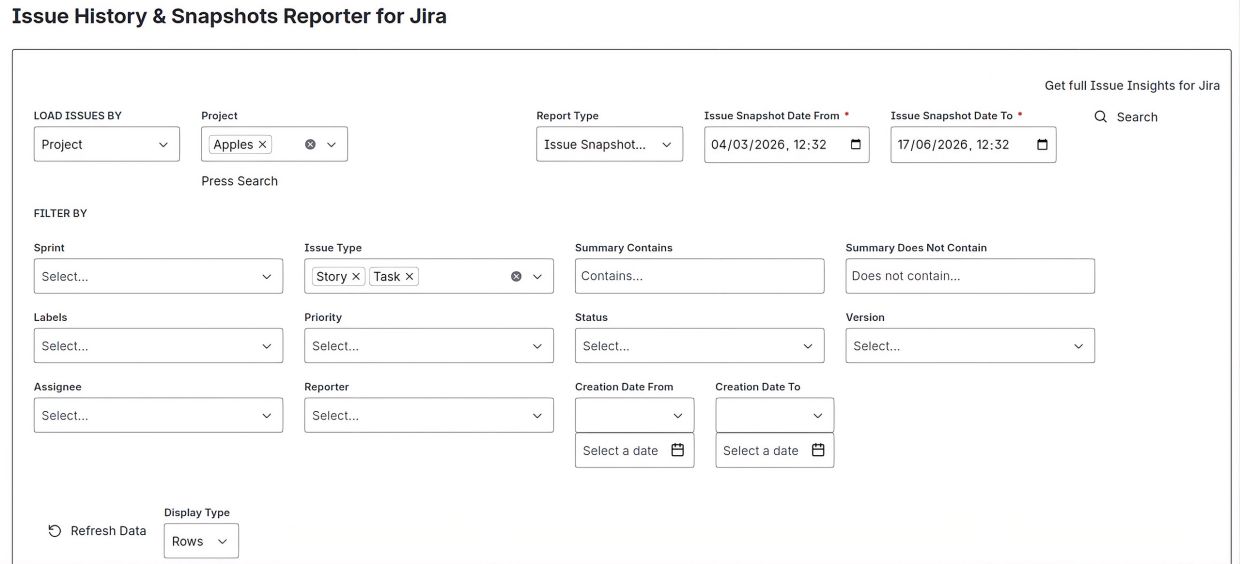
When Issue Snapshot Comparison is selected as the report type, choose the start and end date and time that define the comparison period. The report will reconstruct each issue as it existed at both selected moments and compare the values of all available fields. Only fields whose values changed between the two snapshots are included in the results, allowing users to quickly identify how issues evolved over the selected period using the issue history available in Jira.
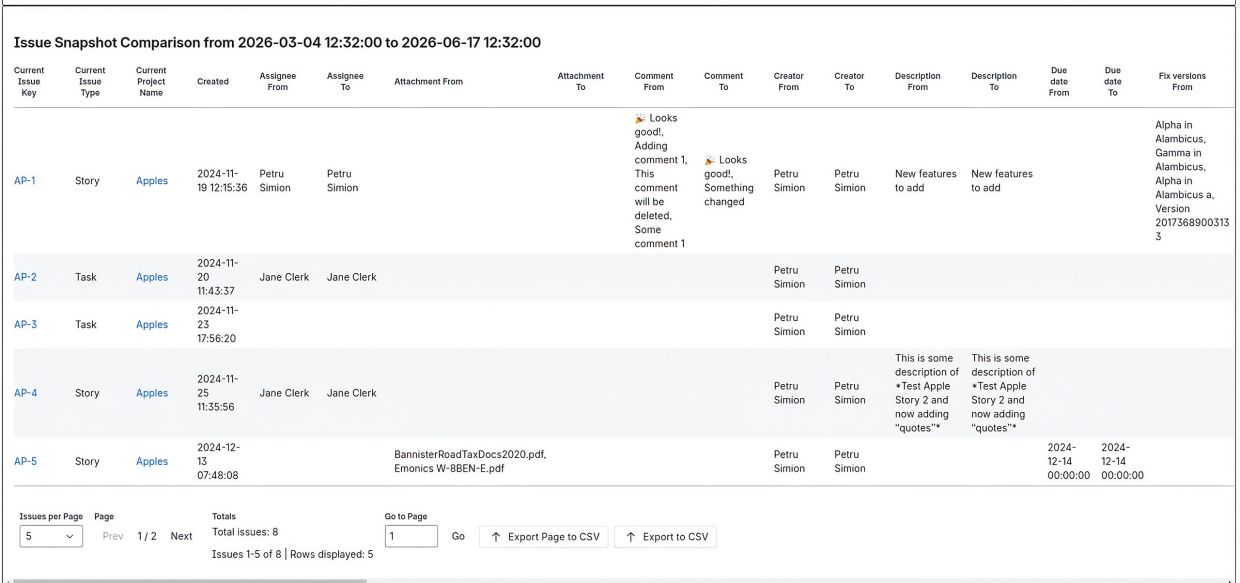
Issue Snapshot Comparison – Column-Based Search Result
The result is presented in a table with sortable columns. Each row represents a single issue for which at least one field value changed between the selected snapshot dates.
The table contains one pair of columns for each field that changed during the comparison period. For every changed field, the report displays the value that existed at the Issue Snapshot Date From and the value that existed at the Issue Snapshot Date To.
In addition to standard Jira fields, the report may include custom fields, Agile fields, Assets fields, and other application-specific fields available in the Jira instance.
Only fields whose values differ between the two selected snapshots are included in the result. Fields that have identical values at both dates are omitted, allowing users to focus exclusively on the changes that occurred during the selected period.
Because the number of changed fields can be large, the table provides a horizontal scrollbar, allowing users to navigate through all available comparison columns without limiting the information displayed.
The Issue Snapshot Comparison report provides a point-in-time comparison of issue states and enables users to quickly identify how issues evolved between two selected moments, making it particularly useful for auditing, compliance reviews, release analysis, sprint reviews, and investigative reporting.
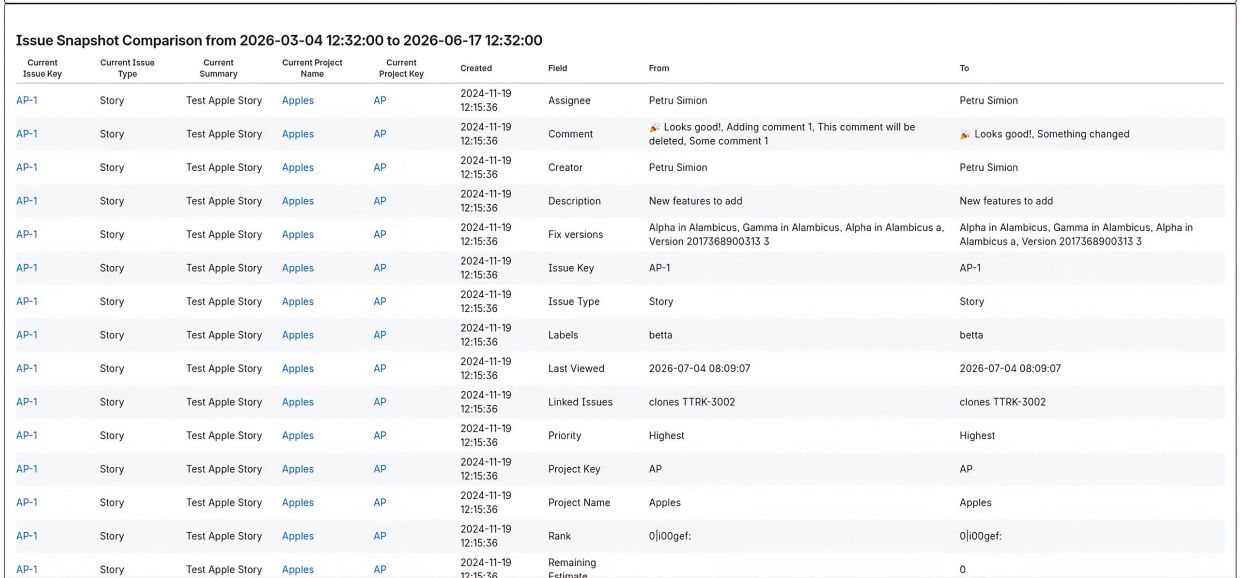
Issue Snapshot Comparison – Row-Based Search Result
The result is presented in a table with sortable columns. Each row represents a single field whose value changed between the selected snapshot dates for a specific issue.
For every returned issue, the report displays one row for each field that contains different values at the Issue Snapshot Date From and Issue Snapshot Date To. Alongside the issue information, the report identifies the field name together with its value at both selected moments.
Only fields whose values changed during the comparison period are included in the results. Fields with identical values at both snapshot dates are omitted, allowing users to focus exclusively on the changes that occurred between the selected dates.
In addition to standard Jira fields, the report may include custom fields, Agile fields, Assets fields, and other application-specific fields available in the Jira instance.
This format is particularly useful when users need to review, filter, export, or analyze individual field changes across large issue sets. By displaying each changed field as a separate row, the report provides a compact and normalized view of issue evolution over time.
The Issue Snapshot Comparison report enables users to quickly identify what changed, which fields were affected, and how values evolved between two selected moments, making it particularly useful for auditing, compliance reviews, release analysis, sprint reviews, and investigative reporting.
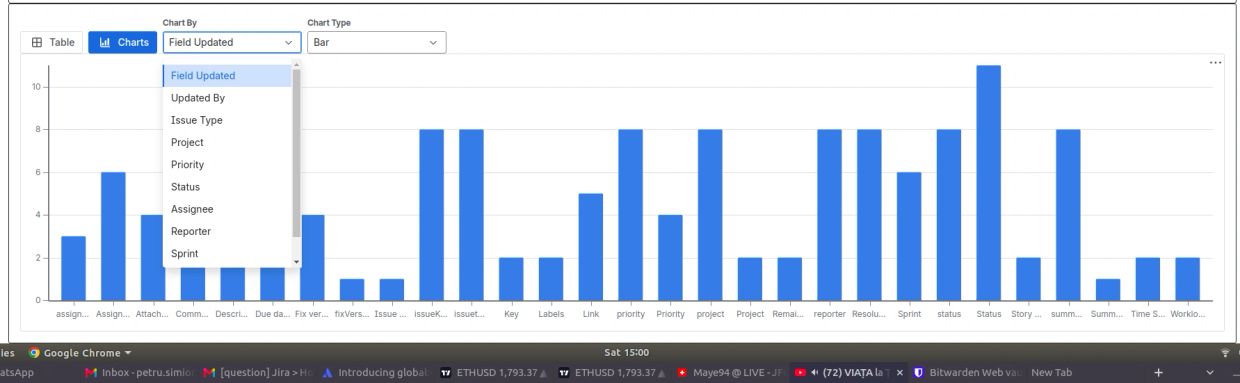
Issue History - The Bar chart illustrates the changes in field values across the selected period.
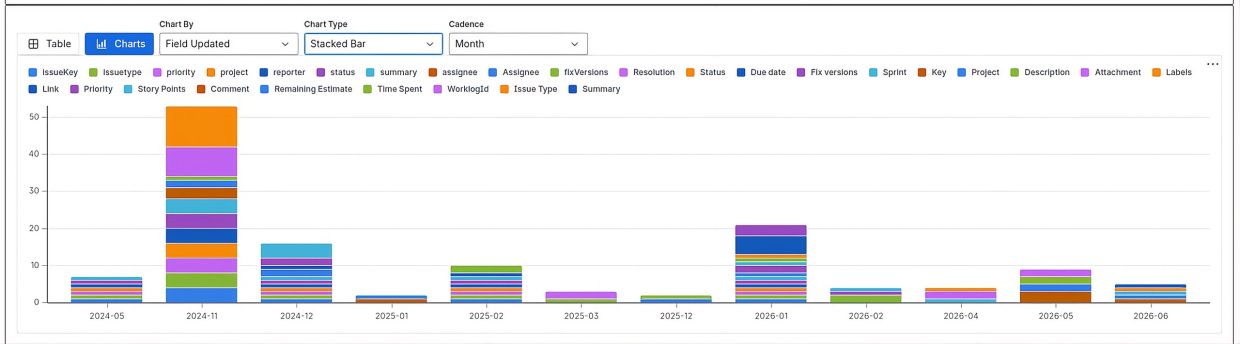
Issue History - The Stack Bar chart shows how fields changed over the selected time period.
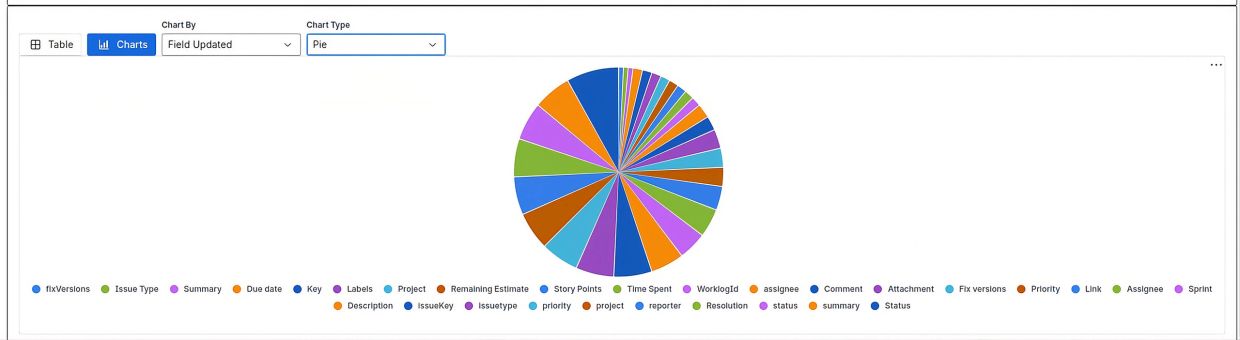
Issue History - The Pie chart illustrates the changes in field values across the selected period.