The application guides users through a flexible workflow for retrieving issues and generating time-based workflow analytics.
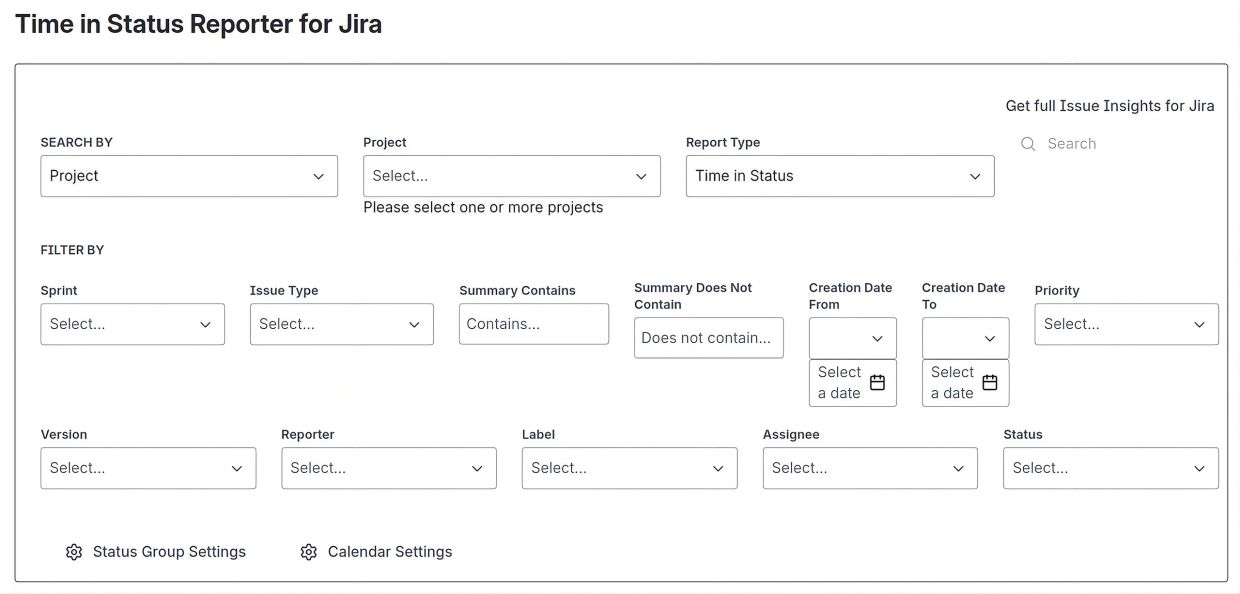
Users begin by selecting a Search By method and a Report Type. Issues can be retrieved using thirteen different selection methods: Assignee, Creation Date, Filter, Issue, Issue Type, Label, Project, Priority, Reporter, Status, Sprint, Summary, and Version. Each method supports single or multiple values, allowing issue sets to range from a single issue to large, dynamically defined collections spanning multiple projects, users, issue types, sprints, versions, or other criteria.
The application supports eight report types:
Assignee Time in Issue, Assignee Time in Status, Assignee Time in Status Group, Status Entry Count, Status Entry Date, Time in Status, Time in Status Group, and Transition Count.
By default, Search By is set to Project and Report Type is set to Time in Status.
The Filter By section is optional. If no filters are specified, all issues matching the selected retrieval method are included in the report. When one or more filters are provided, the retrieved issue set is refined before the report is generated, allowing users to focus on specific projects, issue types, statuses, assignees, reporters, sprints, versions, labels, priorities, creation dates, or summary text patterns.
Once the search is executed, the application calculates the requested workflow metrics and displays the results in the format required by the selected report type. Depending on the selected report, users can analyze time spent in statuses, time spent in status groups, status entry dates, status entry counts, transition counts, or assignee-based workflow metrics.
The application is designed for enterprise-scale Jira environments and has been tested with instances containing more than one million issues. Large datasets are processed using paginated data retrieval, allowing users to generate workflow analytics and reports efficiently without loading all issue data at once.

Status Group and Calendar Settings
The application supports both Global and User configurations for Status Groups and Calendars.
Global configurations are available to all users and are managed by Jira administrators.
User configurations are available only to the user who created them.
Status Groups are used by the Time in Status Group and Assignee Time in Status Group reports, while Calend

Create/Edit Status Group
To create a status group, enter a unique Status Group Name and define the statuses that belong to the group for each applicable issue type.
For every issue type, select one or more Jira statuses that should be treated as a single reporting category.
Additional issue types can be added using the Add Issue Type option, and existing mappings can be removed using the Remove link

Create/Edit Calendar
Calendars define the working schedules used by the application's time-based reports and calculations.
When creating or editing a calendar, specify a Calendar Name and Time Zone, then configure the working schedule for each weekday.
One or more Time Slots can be defined for a day, allowing support for schedules with multiple working periods, such as morning and afternoon shifts s
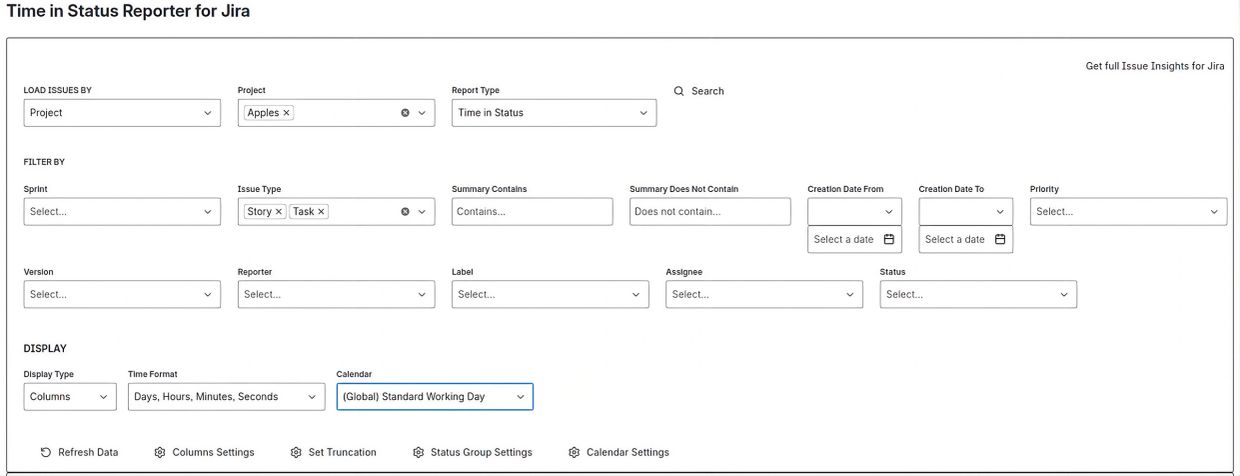
In this example, issues are retrieved from the selected project and further refined using the Filter By criteria before the report is generated. Only issues matching the specified filters are included in the calculations and displayed in the results.
Additional reporting options can be configured before running the report:
- Display Type – determines how the results are presented. Available options are Columns and Rows.
- Time Format – controls how calculated durations are displayed. Available formats are Days, Hours, Minutes, and Seconds.
- Calendar – specifies the calendar used for time calculations. In this example, the (Global) Standard Working Day calendar is selected.
These options allow users to tailor the presentation and calculation of workflow metrics to match their reporting requirements.
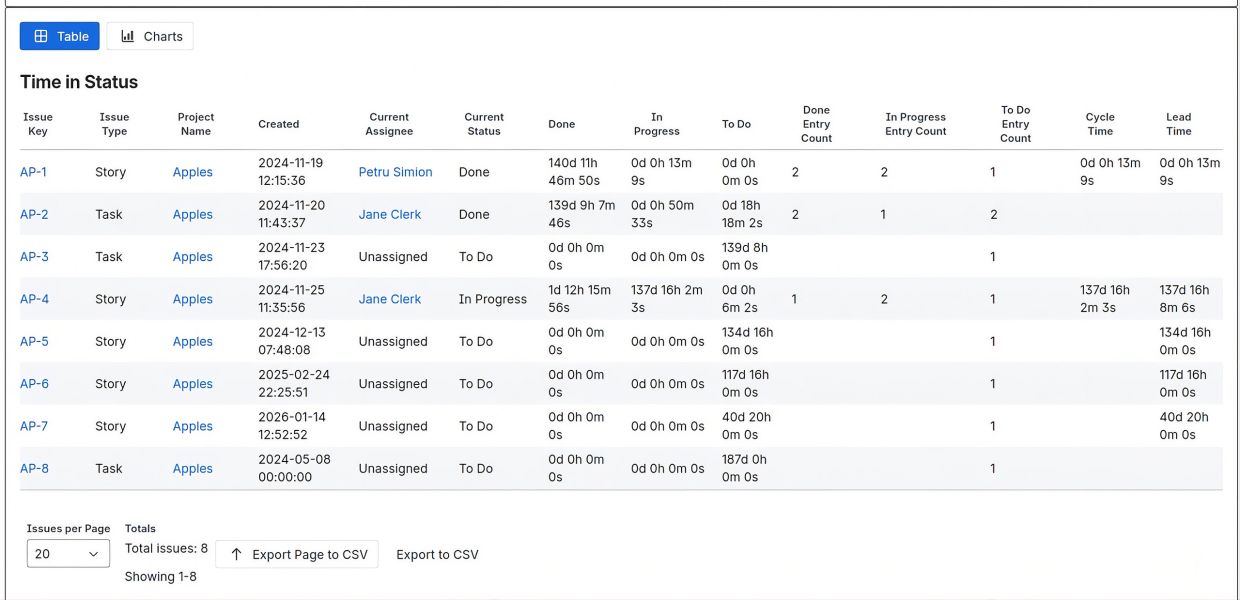
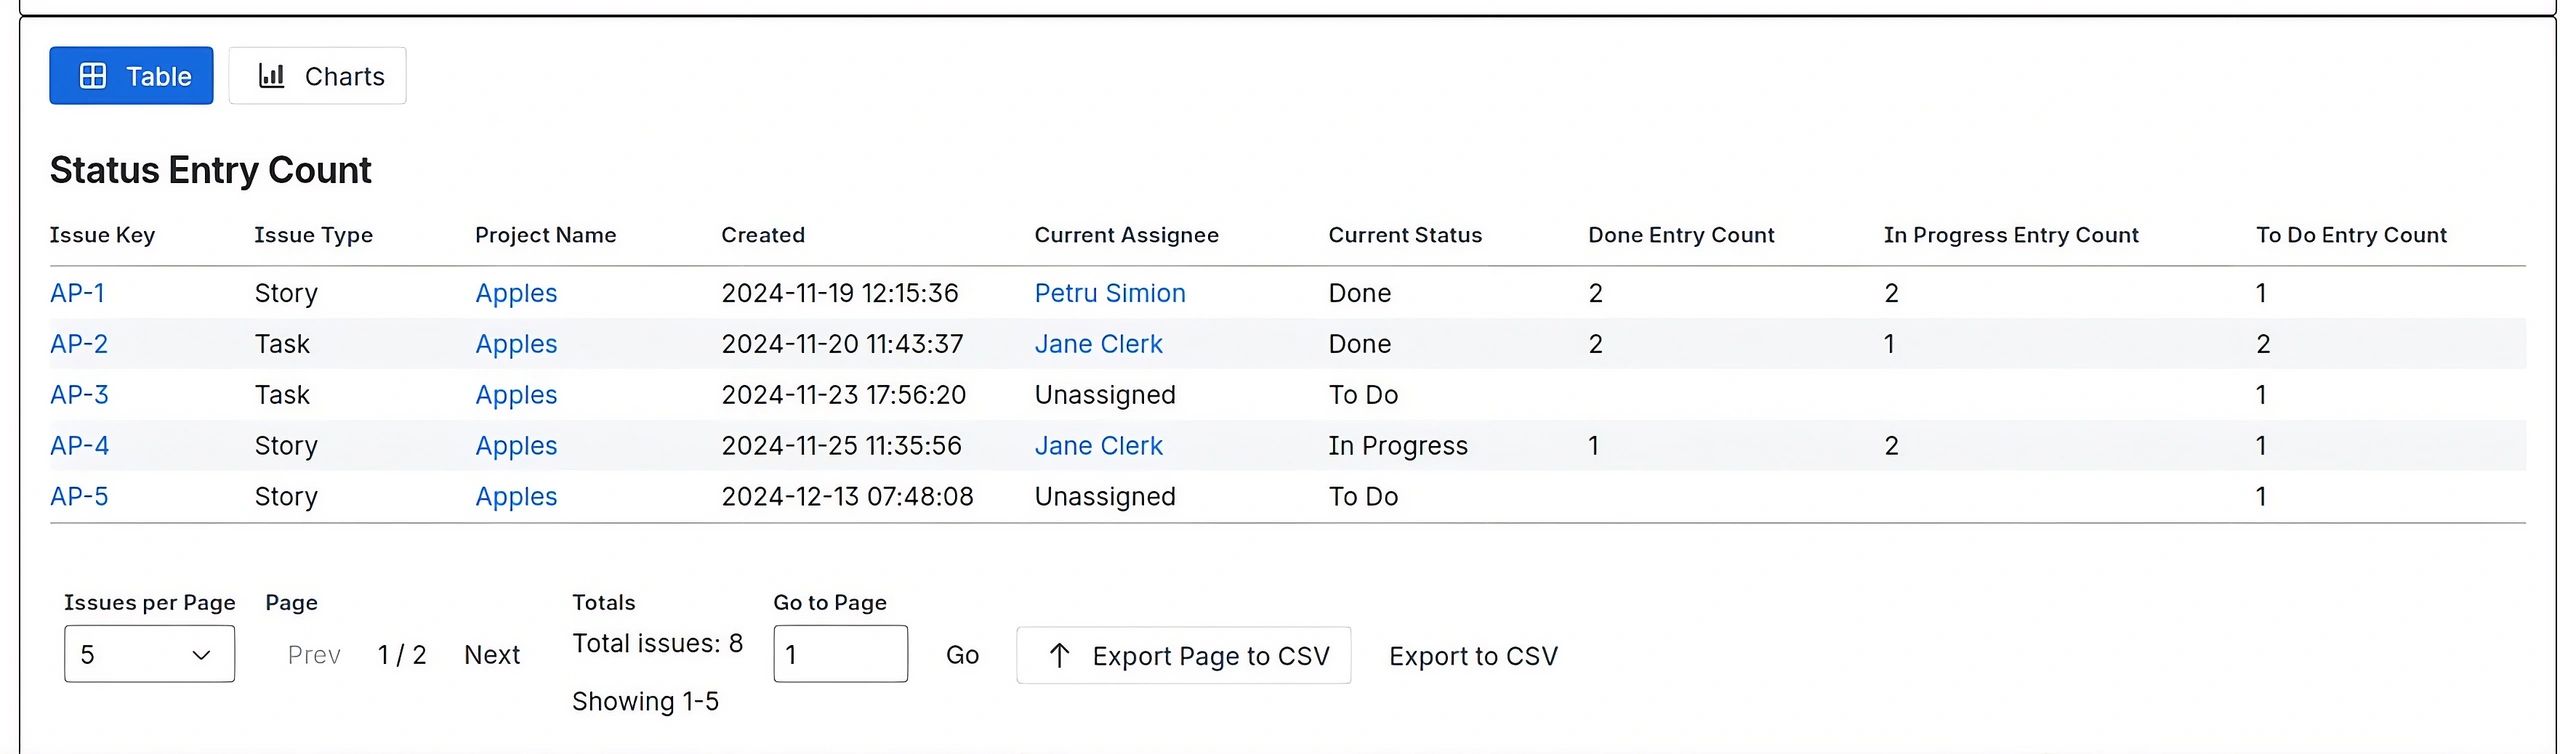
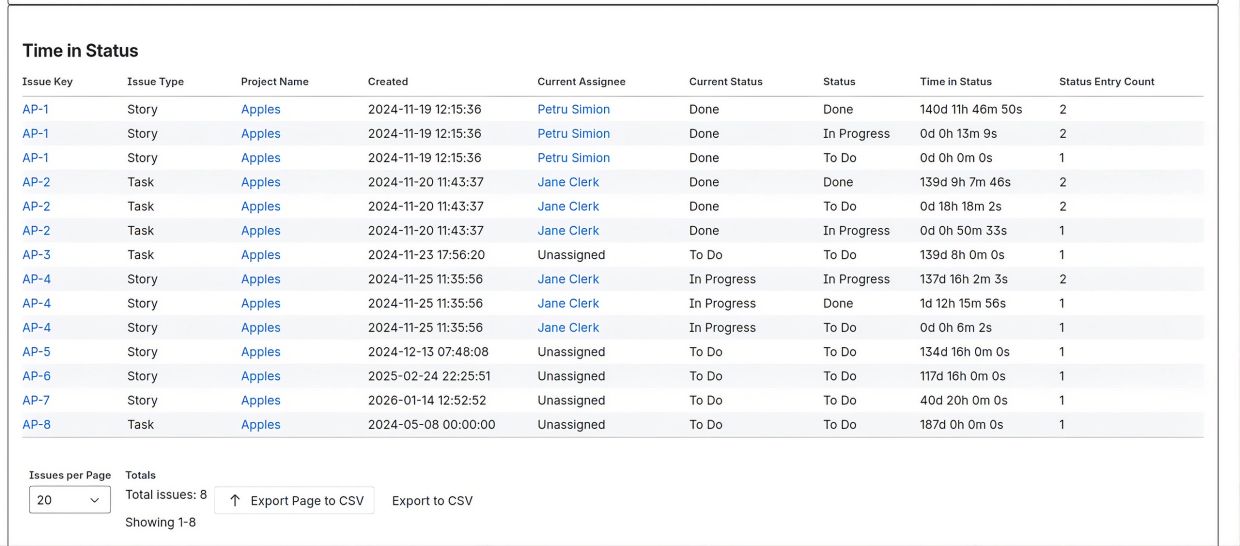
Time in Status – Column-Based Search Result
The result is presented in a table with sortable columns. Each row represents a single issue and displays the workflow metrics calculated for that issue.
In addition to standard issue information, the report contains two main groups of calculated columns:
- Status and Status Group Duration Columns – display the total amount of time an issue accumulated in each status or status group. If an issue entered the same status multiple times during its lifecycle, all time spent in that status is aggregated into a single value.
- Status and Status Group Count Columns – display the number of times an issue entered a particular status or status group during its lifecycle.
Depending on the selected report type, the table may also include additional calculated metrics such as cycle time, lead time, transition counts, status entry dates, or assignee-based workflow measurements.
The values shown are calculated using the issue history available in Jira and, when applicable, the selected calendar and time format settings. Time-based values are displayed using the selected Time Format, while calculations requiring working hours use the selected Calendar configuration.
Because the number of statuses, status groups, or calculated metrics can vary between Jira instances and projects, the table supports horizontal scrolling, allowing all generated columns to be displayed without limiting the report contents.
The Set Visible Columns option allows users to select which columns are displayed in the table, while Set Truncation allows selected columns containing large text values to be truncated for improved readability. These settings affect only the visual presentation of data within the application.
The application provides two export options:
- Export Page to CSV exports only the records displayed on the current page.
- Export to CSV exports the complete result set.
Both export options always include all generated columns and export values in their complete, untruncated form, regardless of any visible column or truncation settings applied to the table.
Time in Status – Row-Based Search Result
The result is presented in a table with sortable columns. Unlike the column-based view, each row represents a single calculated metric for a specific issue.
For status-based reports, the table displays one row for each status or status group associated with an issue. The report identifies the issue, the status or status group being analyzed, the total accumulated time spent in that status or group, and any additional calculated metrics relevant to the selected report type.
This format provides a normalized view of workflow data and is particularly useful when filtering, exporting, or performing further analysis in external reporting tools. Because each status or status group is represented by a separate row, a single issue may generate multiple rows in the result set.
The row-based layout is especially useful for large reports containing many statuses, status groups, or calculated metrics, as it reduces the number of columns displayed while preserving all calculated values.
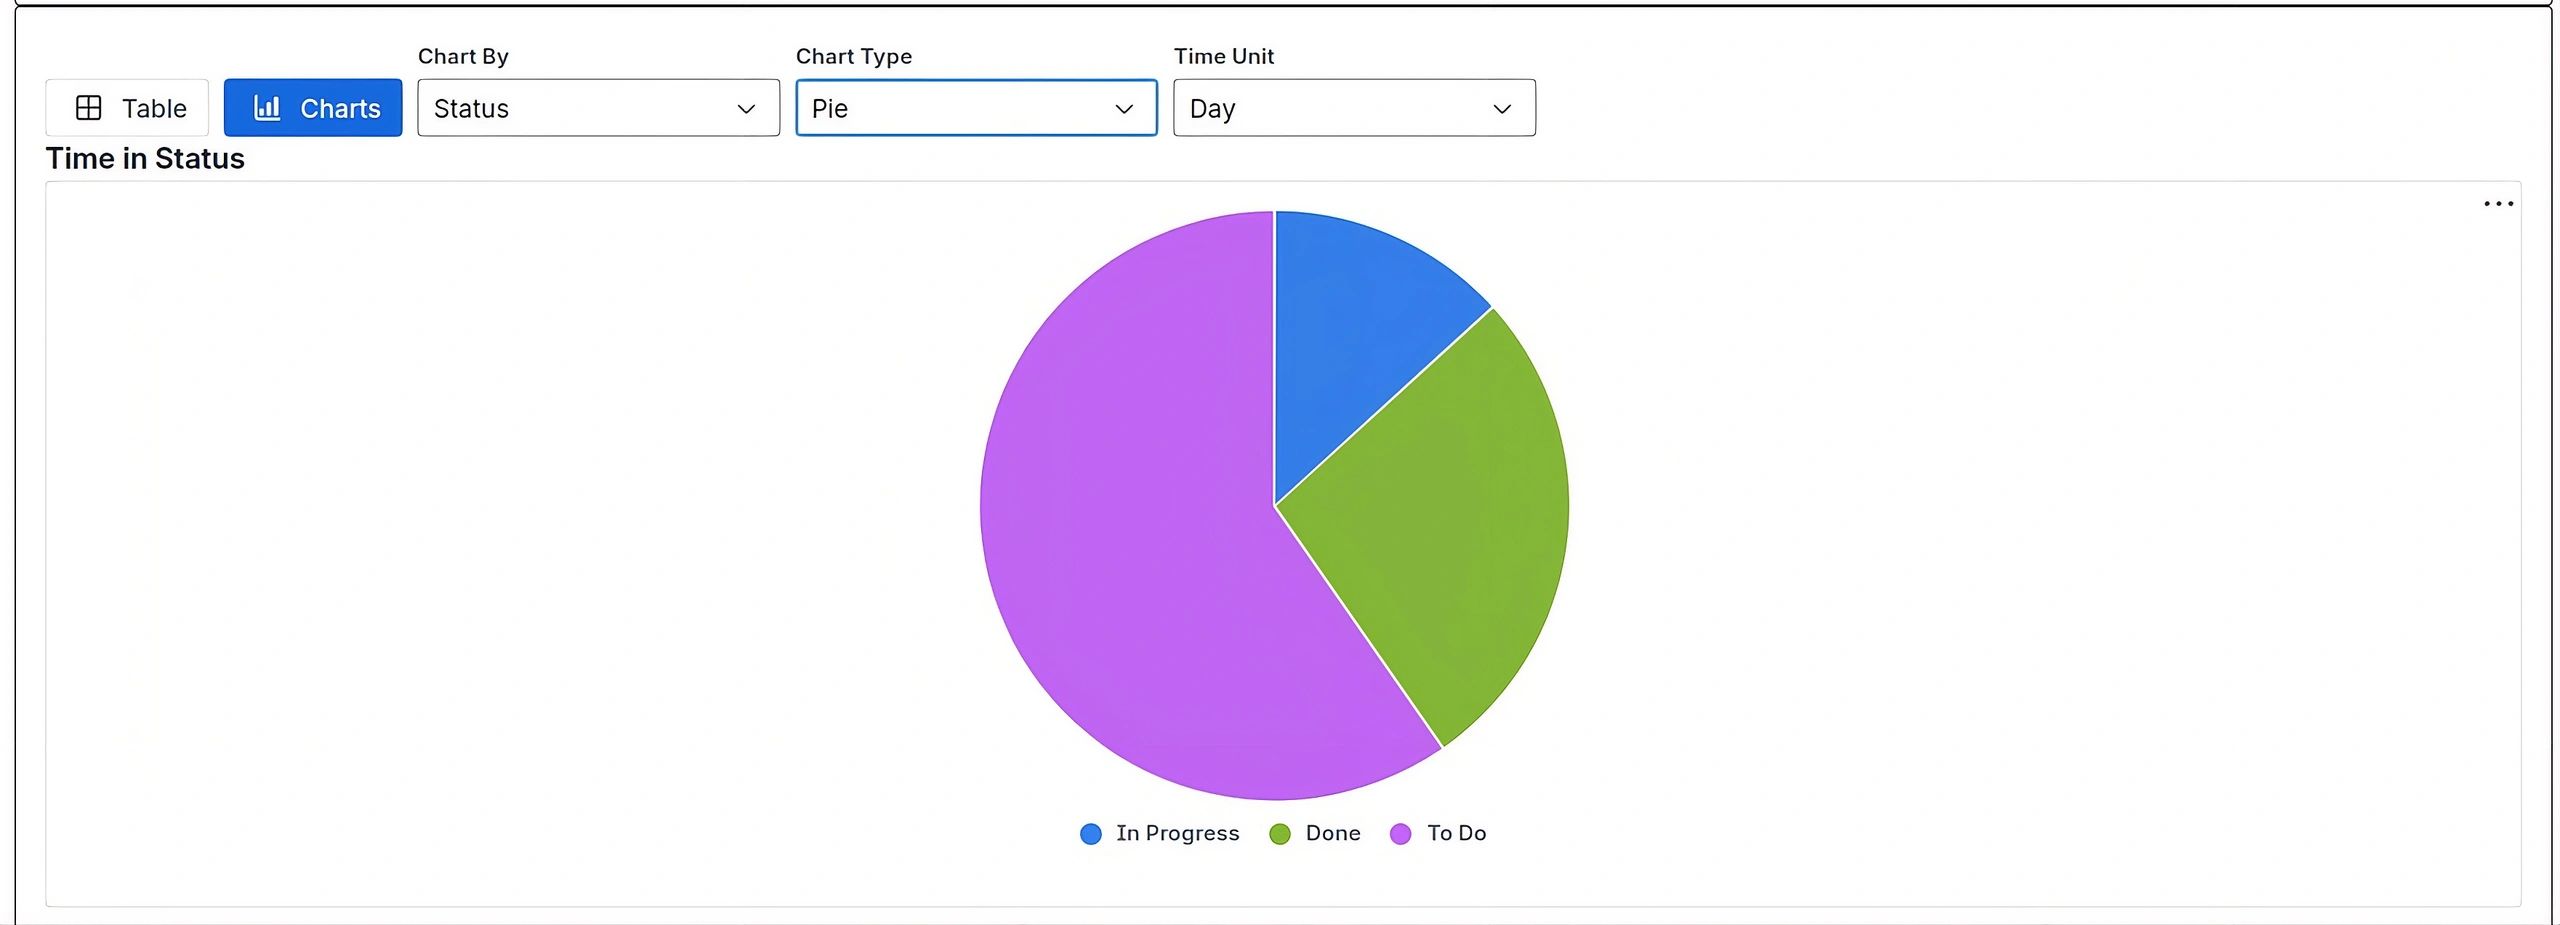
Bar, Stacked Bar and Pie charts


Nine more report types