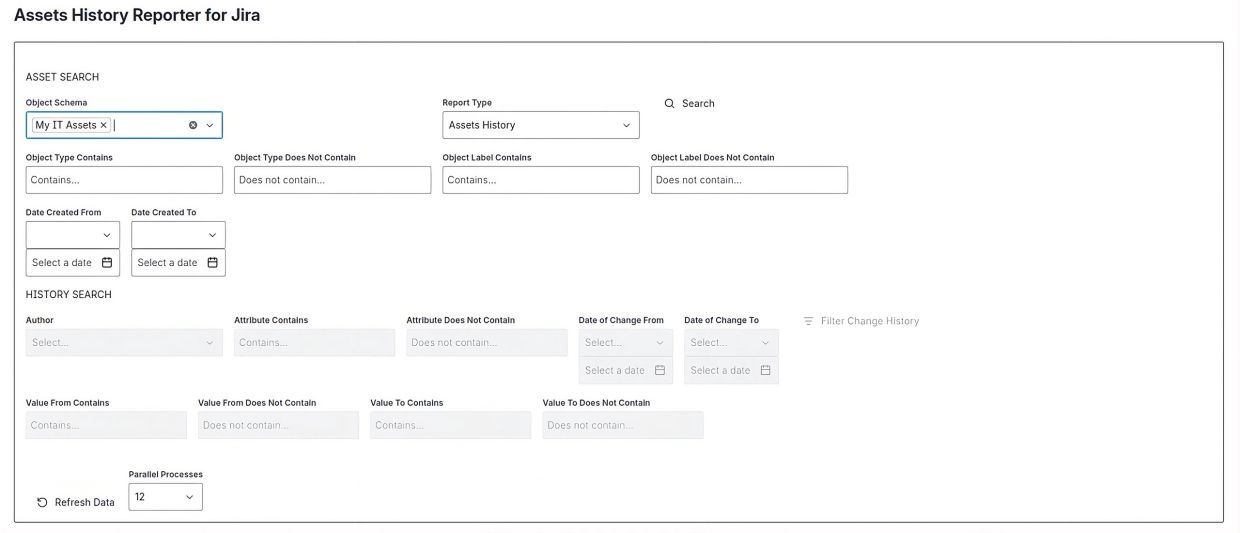
The first step is to select the assets you want to analyze.
Use the Object Schema field to select one or more Assets schemas. The application will search only within the selected schemas. Once one or more schemas have been selected, additional filters can be used to further narrow the asset set before loading data.
Available asset filters include:
Object Type Contains, Object Type Does Not Contain, Object Label Contains, Object Label Does Not Contain, Date Created From, and Date Created To.
After selecting the desired schemas and optional filters, click Search. The application retrieves all matching assets and loads the initial result set.
The Report Type determines how the retrieved assets will be analyzed and displayed. Available report types are:
Assets History, Asset Snapshot, and Asset Snapshot Comparison.
The Refresh Data button reloads information from Jira Assets, ensuring that newly created or recently modified assets are included in subsequent searches and reports.
The Parallel Processes setting controls the number of concurrent requests used when retrieving large volumes of asset history data. Higher values may improve performance when processing large result sets.
This setting is available only to Jira administrators and is applied globally across the application for all users.
Increasing the number of parallel processes can improve the performance of operations such as History Search, chart generation, and large pagination jumps when working with substantial amounts of asset history data. However, performance gains depend on the size of the Assets environment, the volume of history being retrieved, and the capacity of the Atlassian APIs.
Atlassian applies rate limits and other platform protections that may occasionally cause requests to be temporarily rejected when a high level of parallel processing is used. If this occurs, the application will display a retry message. After the user confirms the retry, processing resumes from the point at which it stalled rather than restarting the entire operation, allowing large searches and reports to continue with minimal disruption.
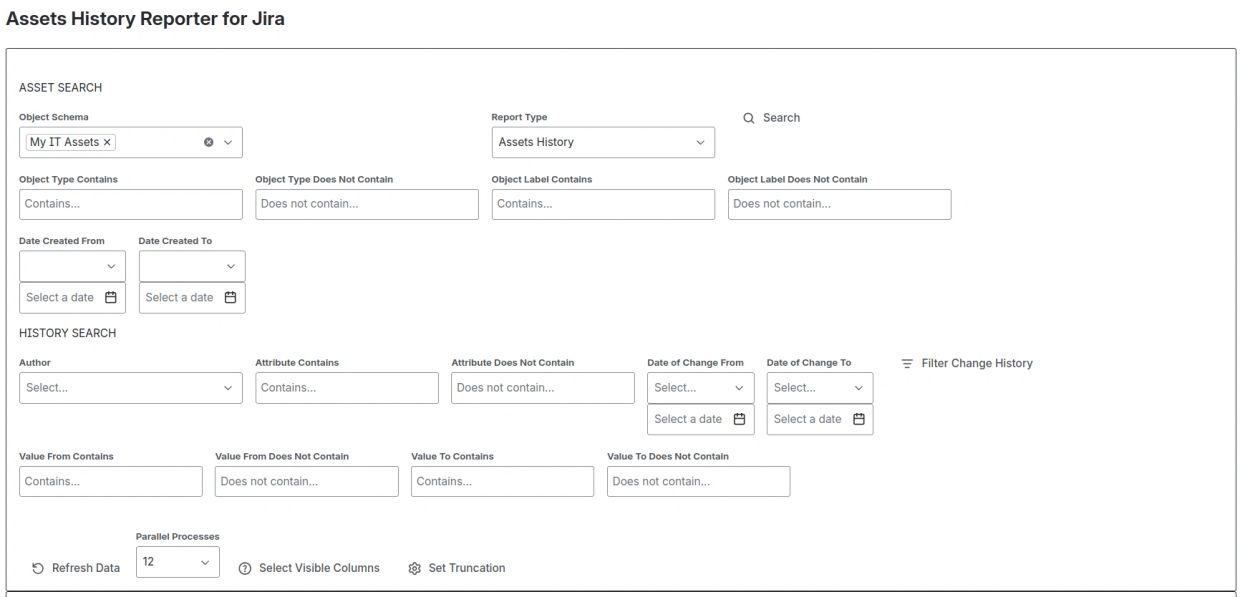
History Search section becomes available after the initial asset set has been loaded. These filters allow users to further narrow the history records associated with the retrieved assets without performing a new asset search.
Available history filters include:
Author, Attribute Contains, Attribute Does Not Contain, Date of Change From, Date of Change To, Value From Contains, Value From Does Not Contain, Value To Contains, and Value To Does Not Contain.
The Filter Change History action applies these criteria to the already loaded asset history, allowing users to focus on specific attribute changes, users, values, or time periods.
The History Search filters are recommended for result sets containing up to approximately 10,000 assets, although larger asset sets may also be processed depending on the volume of history data associated with the selected assets. For optimal performance, consider narrowing the initial asset set before applying history filters when working with very large Jira Assets environments.
The Select Visible Columns option allows users to choose which columns are displayed in the search results table, making it easier to focus on the information most relevant to their analysis.
The Set Truncation option allows selected columns containing large text values to be truncated to 22 characters for improved readability and more efficient use of screen space. Truncation affects only the table display and does not modify the underlying data.
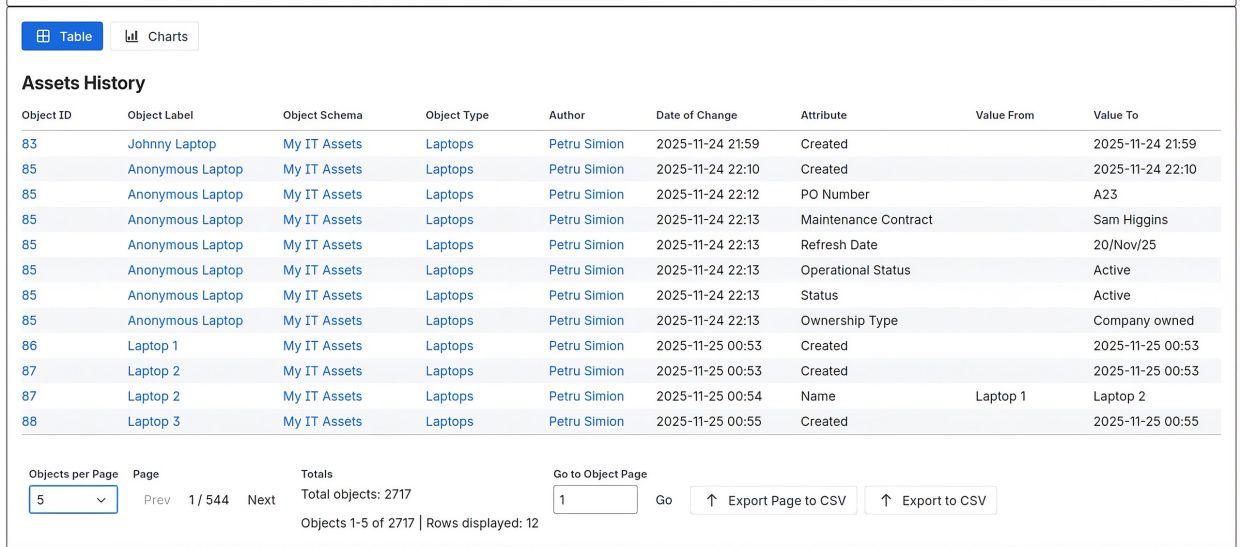
The Assets History report displays the complete change history for the assets returned by the search criteria.
Each row represents a single history event for an asset, showing:
- Object ID – Unique identifier of the asset.
- Object Label – Display name of the asset.
- Object Schema – Schema containing the asset.
- Object Type – Type of the asset.
- Author – User who performed the change.
- Date of Change – Date and time when the change occurred.
- Attribute – Asset attribute that was modified.
- Value From – Previous value of the attribute.
- Value To – New value of the attribute after the change.
This structure allows users to review the complete audit trail of asset changes, including asset creation, attribute updates, ownership changes, status changes, and other modifications performed over time.
The results table supports sorting, pagination, and navigation through large history datasets.
Users can navigate sequentially using the Previous and Next buttons or jump directly to a specific page using the Go to Object Page option.
For very large result sets, sequential navigation using Previous and Next is generally immediate because the required pages have already been indexed. However, jumping directly to a distant page (for example, from page 1 to page 2,000) may require additional indexing and data positioning before the requested page can be displayed. As a result, direct navigation to distant pages may take longer than moving sequentially through adjacent pages.
The number of rows displayed per page can be adjusted using the Objects per Page selector.
The Select Visible Columns option allows users to choose which columns are displayed in the table, while Set Truncation can be used to shorten large text values for improved readability. These settings affect only the table display.
The application provides two export options:
- Export Page to CSV exports only the records displayed on the current page.
- Export to CSV exports the complete result set.
Both export options always include all available columns and export values in their full, untruncated form, regardless of any visible column or truncation settings applied to the table.
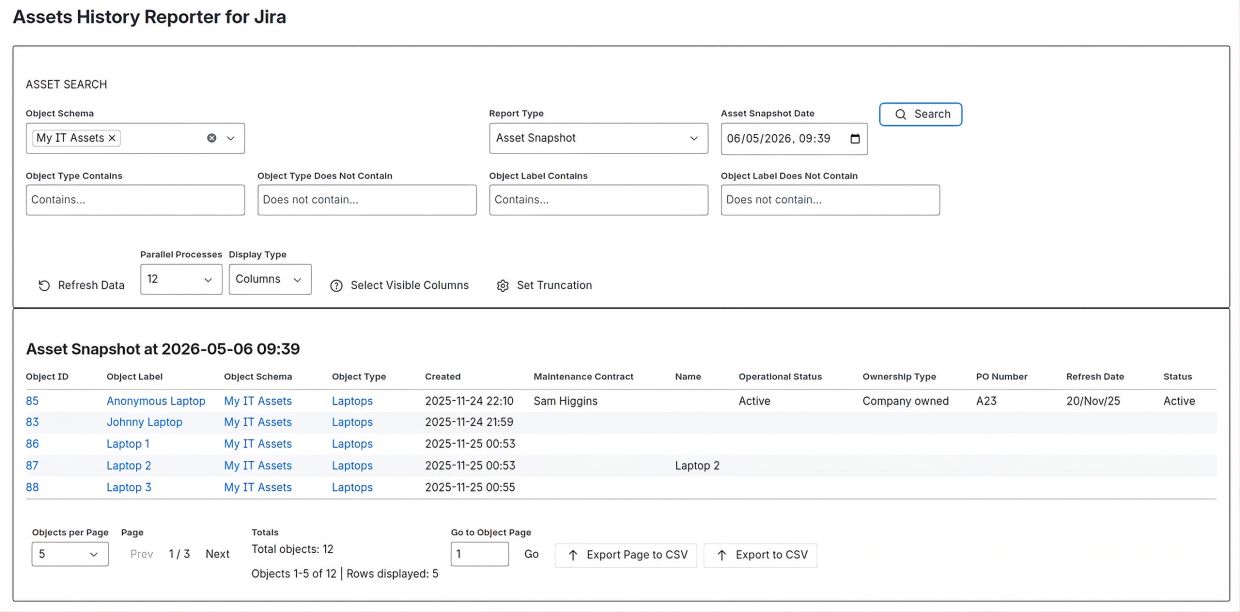
When Asset Snapshot is selected as the report type, the application reconstructs the state of each asset at the specified snapshot date and time using the available Assets history.
Unlike the Assets History report, which shows individual change events, the Asset Snapshot report provides a complete point-in-time view of each asset. Each row represents a single asset, while the columns contain the asset attributes and their values as they existed at the selected moment.
Asset Snapshots are useful for auditing, compliance reviews, investigations, inventory verification, historical reporting, and understanding how assets looked at a specific point in time.
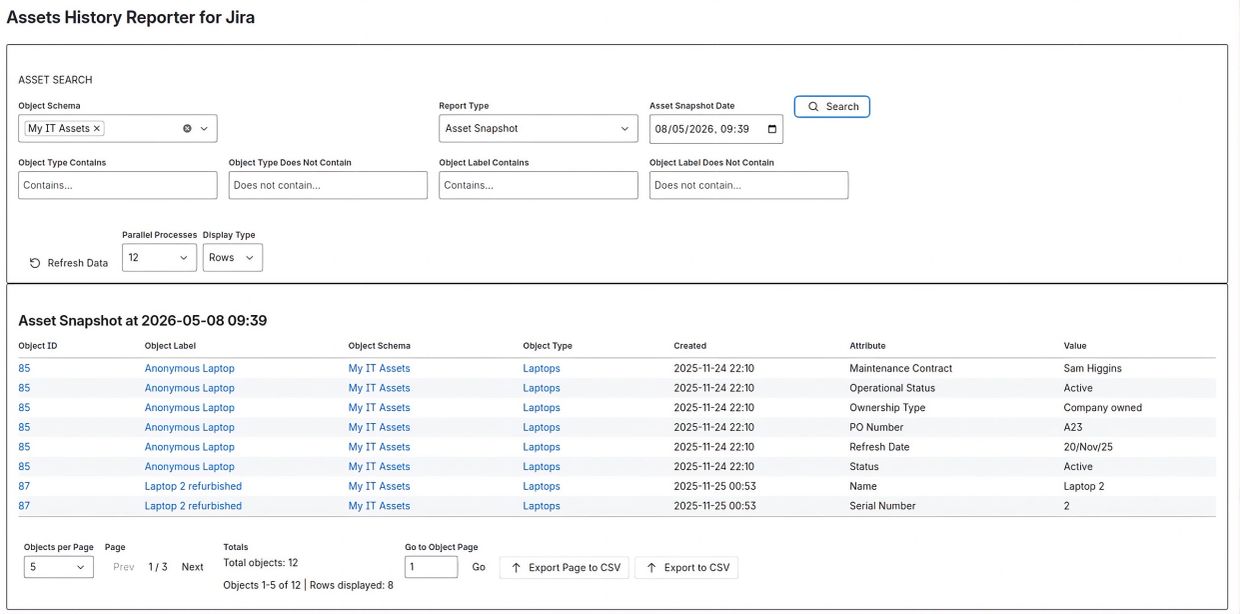
In addition to the standard Columns display, Asset Snapshots can also be displayed using the Rows format.
In this view, each asset attribute is presented as a separate row containing the asset information, attribute name, and attribute value. This format is particularly useful when exporting data for further analysis because it produces a normalized, pivot-friendly dataset.
The Rows display is well suited for reporting and analytics tools such as Microsoft Excel, Power BI, Tableau, Google Sheets, SQL databases, and AI-powered analytics platforms, where users may wish to pivot, aggregate, group, filter, or correlate asset attributes across large datasets.
For many advanced reporting scenarios, the Rows format provides greater flexibility than the Columns format, making it easier to perform custom analysis, build dashboards, create visualizations, and combine asset data with information from other sources.
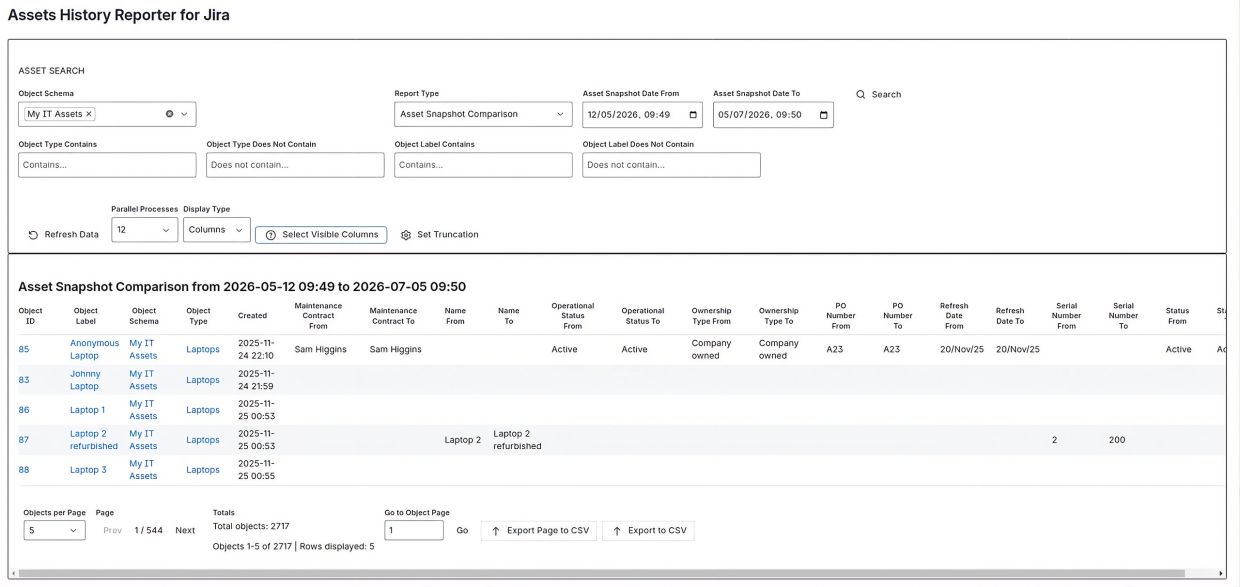
When Asset Snapshot Comparison is selected and the Display Type is set to Columns, the application reconstructs the state of each asset at two different points in time and displays the results side by side.
Each row represents a single asset. For every asset attribute, the report creates two columns:
- Attribute From – the value of the attribute at the first snapshot date.
- Attribute To – the value of the attribute at the second snapshot date.
This layout makes it easy to identify changes between the two snapshots, showing exactly which attribute values were modified, added, removed, or remained unchanged during the selected period.
The Columns display is particularly useful for auditing, compliance reviews, change investigations, and side-by-side comparison of asset states because all asset information and attribute changes can be reviewed in a single row.
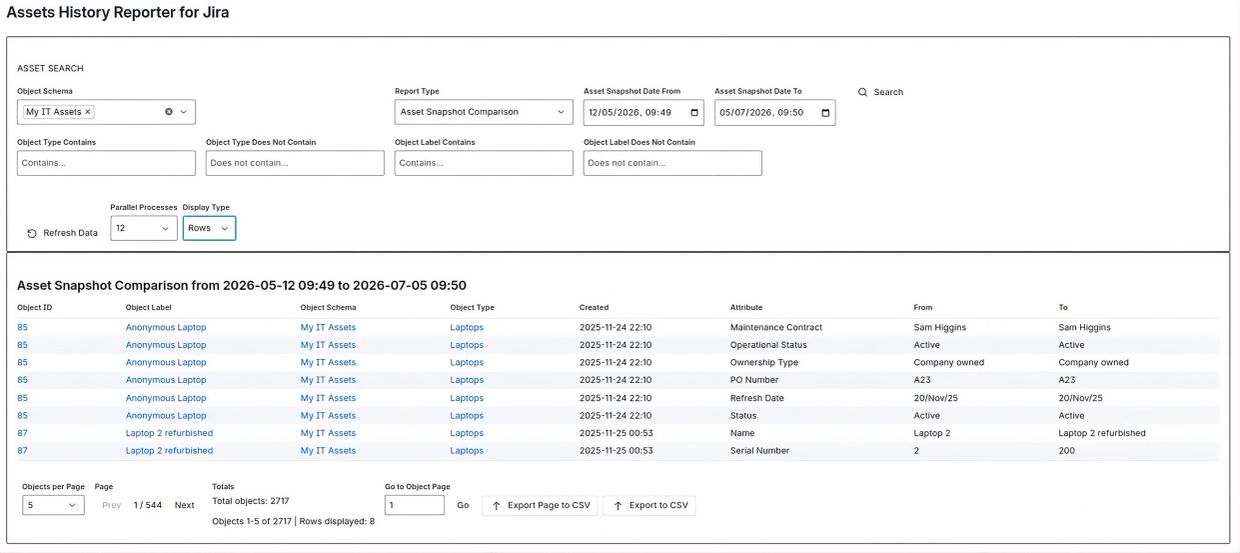
When Asset Snapshot Comparison is displayed using the Rows format, each row represents a single attribute comparison for an asset between the two selected snapshot dates.
The table contains the asset information, the attribute being compared, and the corresponding From and To values. This format makes it easy to identify exactly which attributes changed and what their values were at each point in time.
Unlike the Columns display, where each attribute generates separate Attribute From and Attribute To columns, the Rows display produces a normalized, pivot-friendly dataset that is particularly well suited for export and further analysis.
The Rows format is recommended when working with assets that contain many attributes or when the exported data will be analyzed using tools such as Microsoft Excel, Power BI, Tableau, Google Sheets, SQL databases, or AI-powered analytics platforms. The structure simplifies filtering, grouping, pivoting, aggregating, and identifying attribute changes across large asset populations.
This display format is especially useful for audit, compliance, change tracking, governance, and historical comparison reporting.
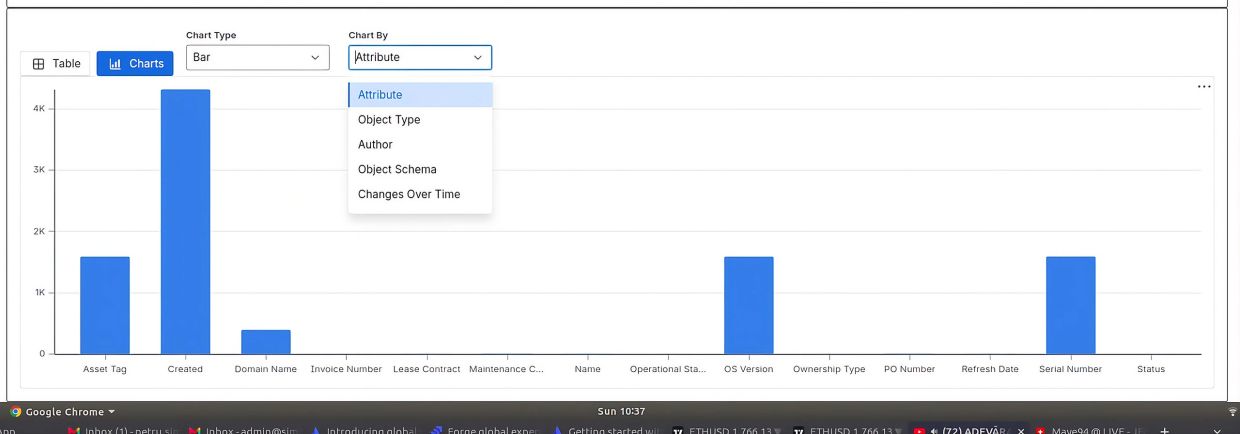
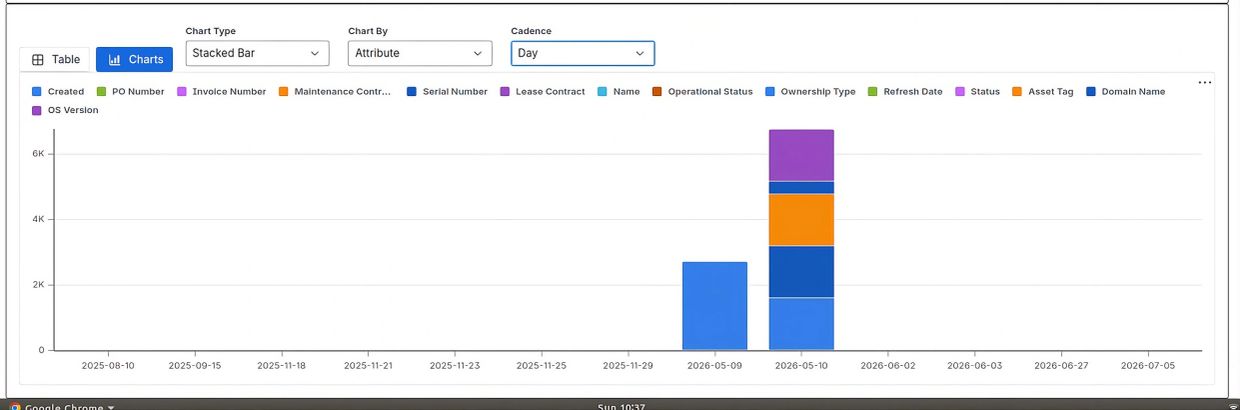
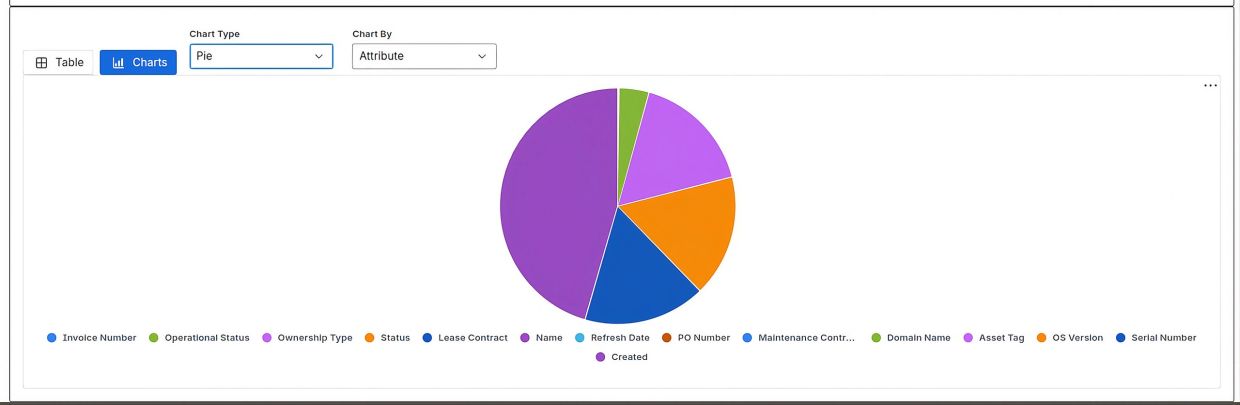
When Issue History is selected as the report type, the resulting history data can be visualized using Bar, Stacked Bar, and Pie charts.
These visualizations help users quickly identify trends, frequently modified fields, change distribution, and overall activity patterns without manually reviewing individual history records.
Charts are particularly useful for analyzing history data across large Jira environments and are recommended, but not restricted, for result sets containing up to approximately 10,000 issues. Larger issue sets may also be processed depending on the volume of history data associated with the selected issues.
For optimal performance when generating charts, users may wish to narrow the issue set or apply additional filtering criteria when working with very large Jira environments.